These are the scenarios rolling through my mind as I watch the Gold Miners ETF $GDX.
It’s easy to lean toward further weakness based on recent selling pressure and the five-year real yield breaking out to fresh decade highs.
But who likes easy? I certainly don’t. I doubt gold bugs do, either.
Luckily, I always defer to price action across multiple time frames for insight. As Brian Shannon always says, “It’s price that pays.”
And in the case of GDX, the charts aren’t as bearish as you might think…
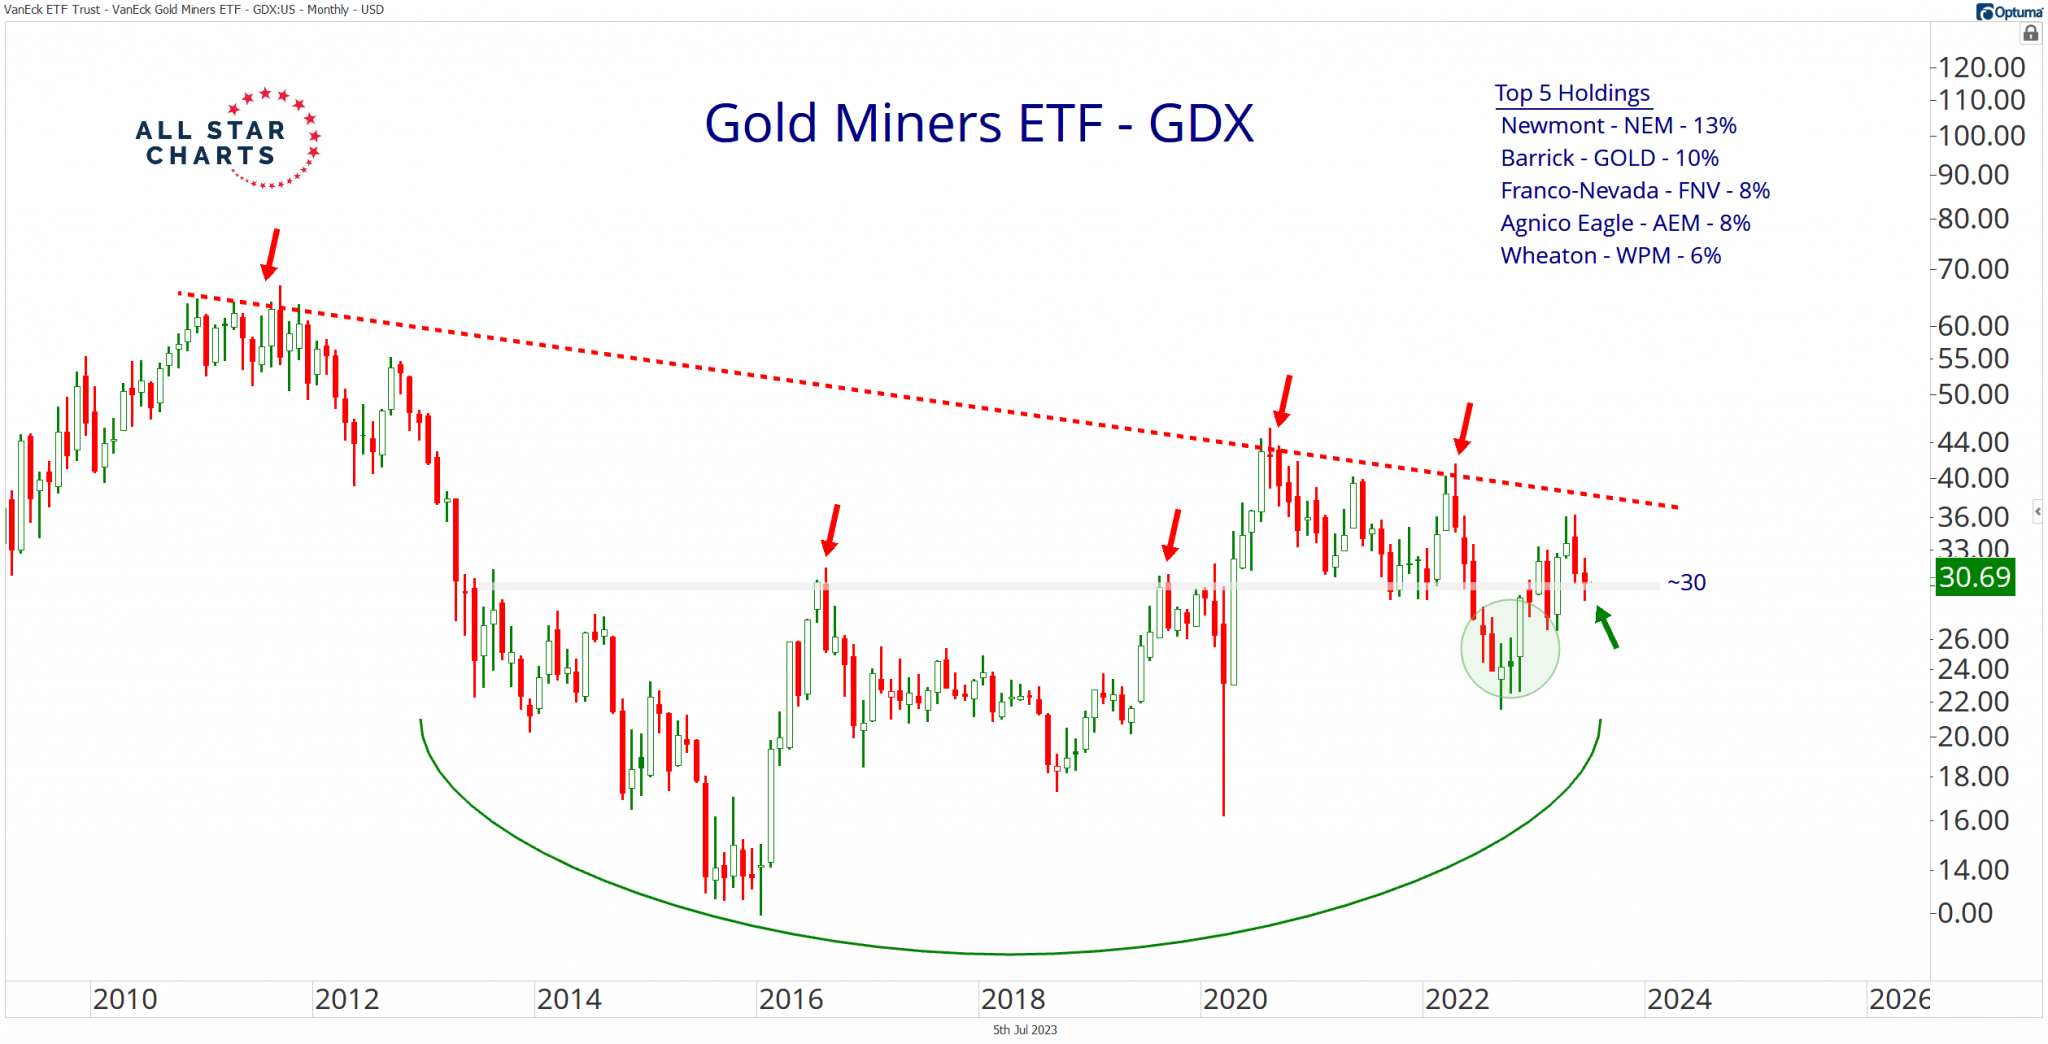
Check out the monthly chart of GDX:
GDX closed the month of June above a critical shelf of former highs at approximately 30 despite slipping below that key level earlier in the month.
I find the monthly close constructive for the bullish case. The prospect of a healthy pullback remains viable as long as it holds above that key level.
On the other hand, the notion of a constructive retest loses validity if price undercuts those former highs.
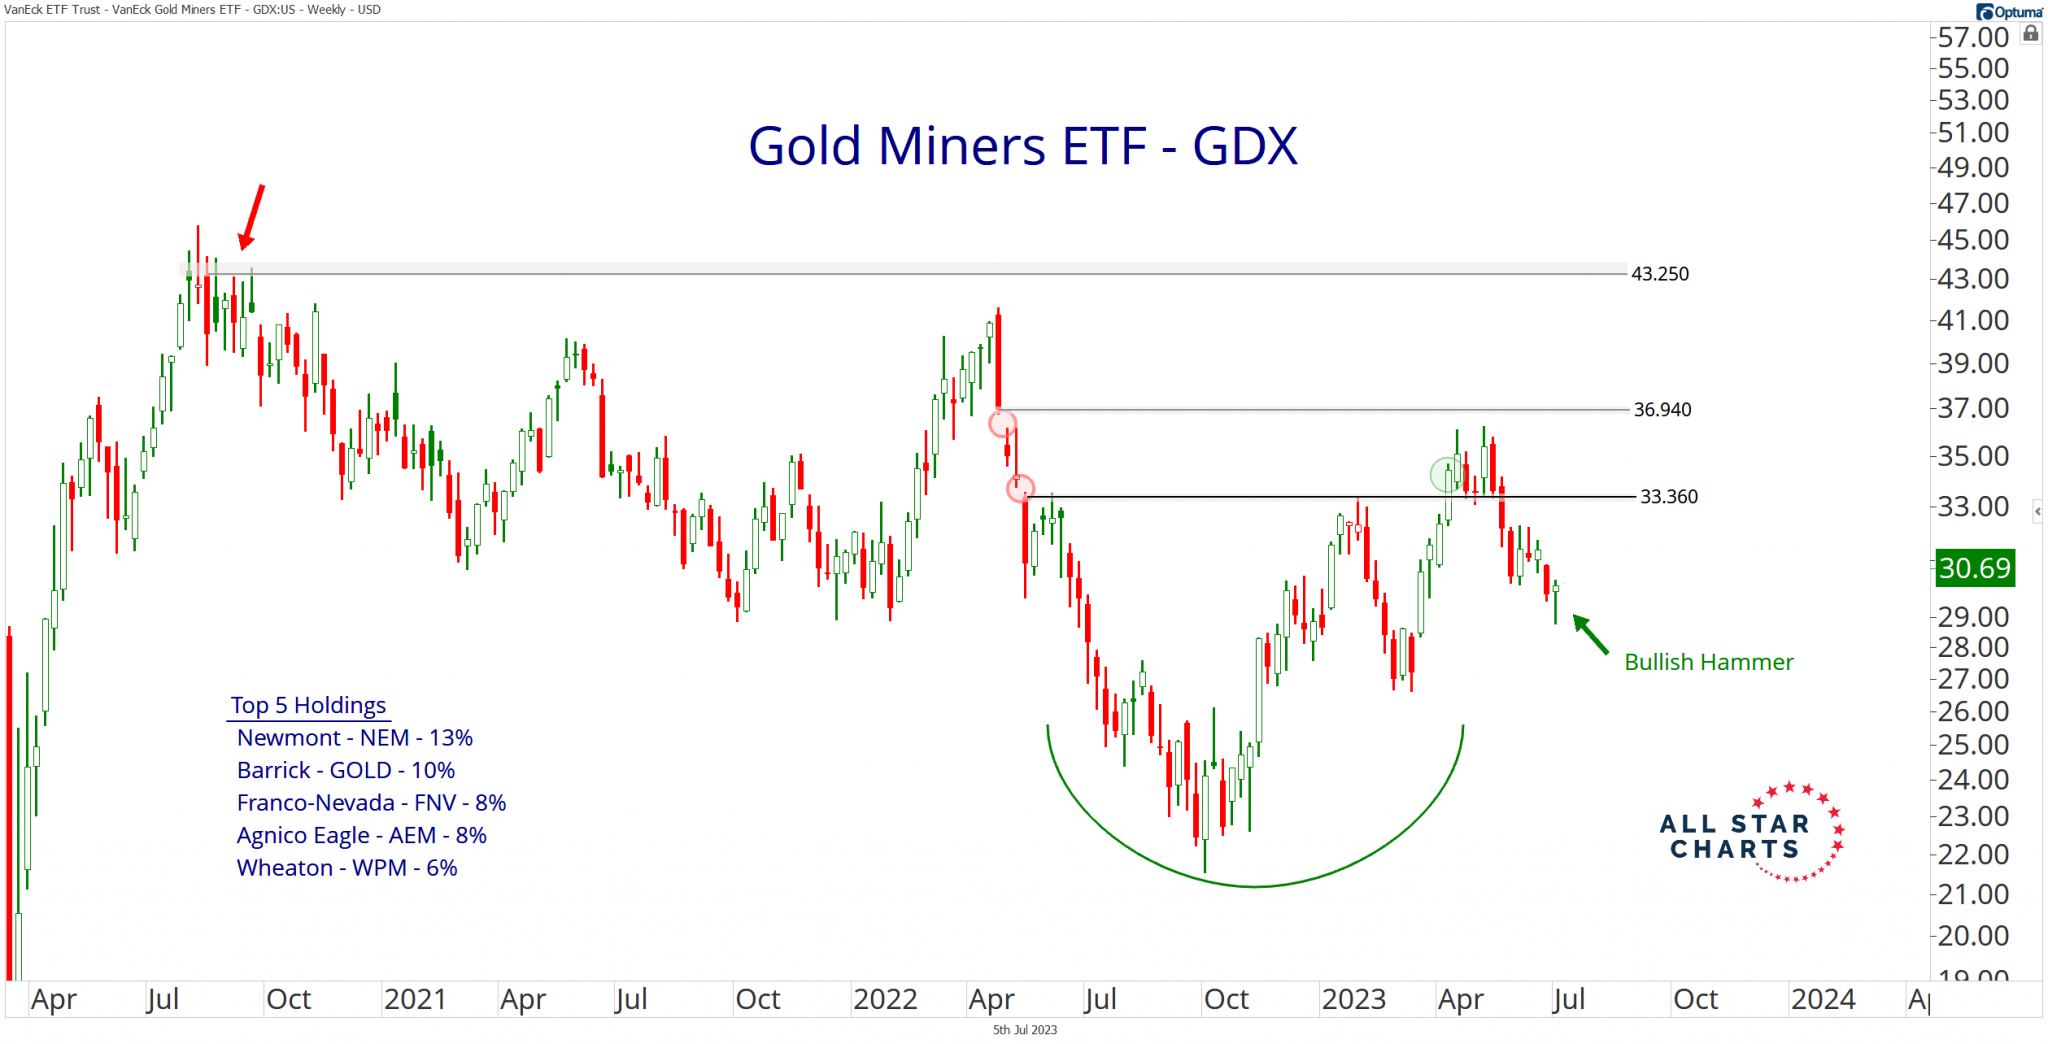
Nevertheless, a look at last week’s candle entertains the possibility of a near-term bottom:
The long lower shadow or “umbrella line” immediately jumps out at me.
Long shadows often signal potential reversals following strong directional moves. This candle, in particular, is called a “hammer,” as bulls hammer out a bottom.
I need to witness upside follow-through in coming weeks to confirm the bullish interpretation.
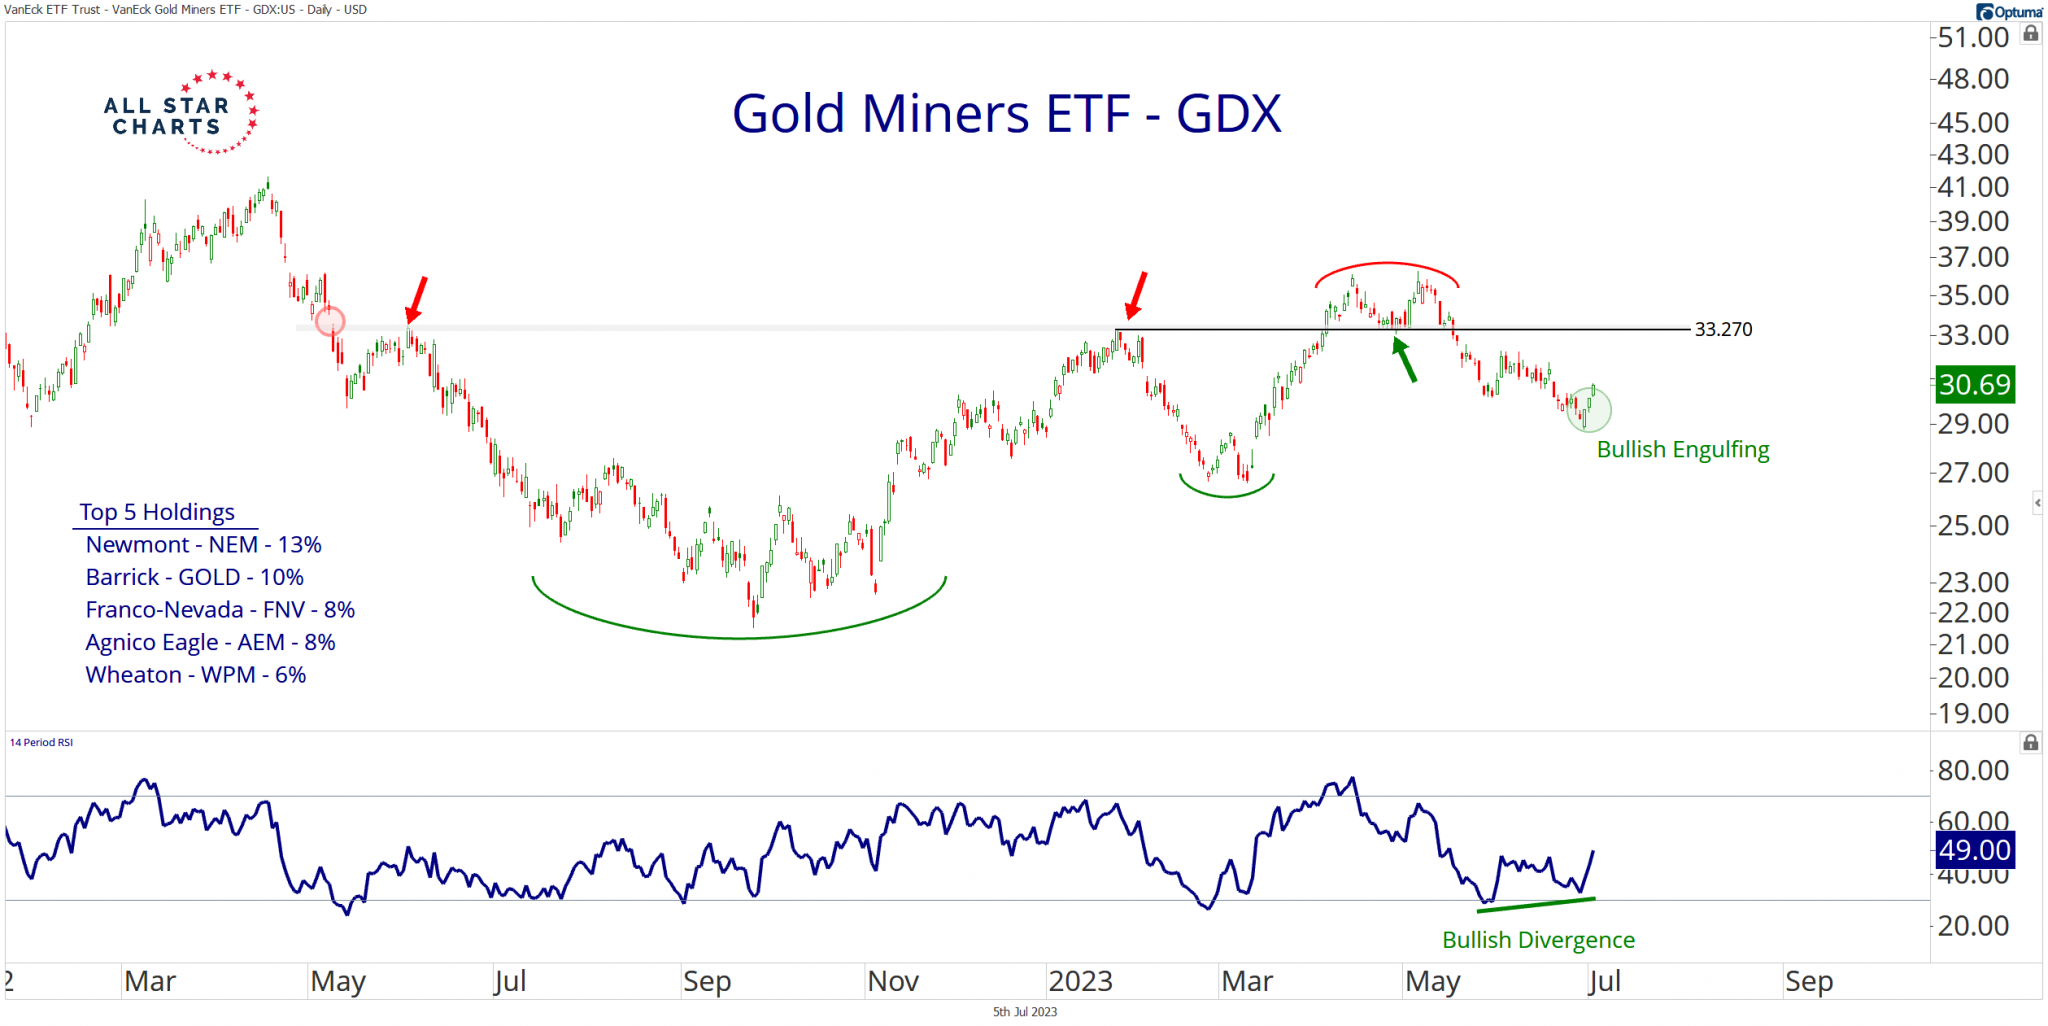
But, from the looks of the daily chart, a near-term bottom may be in place:
GDX posted a bullish engulfing candle with a shaven head last Thursday. This pattern occurs when price opens below the previous day’s close, then closes above the previous day’s open.
The “shaven head” refers to a close at the day’s high. Engulfing candles often signal reversals, while both are viewed as bulls taking control of the session.
Buyers continued to drive prices higher during last Friday’s session, as GDX climbed 1.65%, closing three cents shy of the intraday high.
And if we consider Monday’s candle, we have a candlestick pattern called three white soldiers (another bullish reversal pattern).
The message is clear: Japanese candlestick analysis points to buyers regaining control of the market.
Before I break down the levels, a quick recap…
Monthly candle closing above a critical polarity zone.
The weekly chart exhibits a possible bullish hammer candlestick.
Bullish engulfing marked the potential end of two months of selling pressure as momentum prints a bullish divergence.
As much as the charts suggest this is a great spot to buy the dip in GDX, it all comes down to risk management. That’s what I love most about the setup.
Risk is well-defined at the June 29 low of 28.76. I only want to own GDX if it’s trading above that level. So I’ll know quickly if I’m wrong.
As long as it holds above last week’s low, I’m targeting the 2022 highs at approximately 40.
Perhaps I’m being too cute with this idea. But what’s the harm when the risk is so well-defined?
It’s a tactical entry that has plenty of room to run. And if it falls below my risk level, I’m out!