Phil Pearlman and I had a nice little chat after the close on Friday. This week we focused more on longer-term weekly price charts and internals. Check it out:
Tags: $SPY $FEZ $FXI $ILF $TLT $ZB_F $TNX $SMH $SOX $EEM
Expert technical analysis of financial markets by JC Parets
Phil Pearlman and I had a nice little chat after the close on Friday. This week we focused more on longer-term weekly price charts and internals. Check it out:
Tags: $SPY $FEZ $FXI $ILF $TLT $ZB_F $TNX $SMH $SOX $EEM
Before this goes any further, let me just reiterate that I am not calling for the end of Quantitative Easing, I am not fighting the Fed, and I don’t care what Ben Bernanke says or doesn’t say. I’m only looking at price. That’s the only thing that matters to me.
Now, with that said, I think this is one of the more fascinating developments happening in this market. Let me explain.
All in theory, the end of QE is positive for yields right? Because if the Fed stops trying to lower rates, it is step 1 to higher rates – which is therefore bearish for US Government Bonds. This would also then be positive for US Dollars. Meanwhile, if rates are heading higher there is less of a rush towards dividend paying stocks. Bond investors can go back to buying bonds again. Wouldn’t that be something?
So here is what’s happening right now:
And the biggest question this whole time has been how stocks would react to this “end of QE”. I see two schools of thought: 1) no more QE is bad for stocks because the juice is gone and supposedly the only reason stocks are up is because of the easy money. 2) The end of QE could only come if the economy is so good and stocks are stable enough to handle that, which in theory is good for stocks isn’t it?
Regardless of all the reasoning, the question still stands – is the end of QE good or bad for stocks? Well I’m not sure if this is the end of QE or not. I’m just calling it like I see it and the above mentioned assets are trading as if it is, which to me is the only thing that matters. And the market has spoken, or is speaking. Although we’ve seen some added volatility over the past week, you still need to give stocks a pat on the back. The S&P500 is sitting half a percent from all-time closing highs.
I’m not saying there is a trade to be had here. But I think it’s worth pointing out how this market is behaving and what it could possibly be trying to price in. I’m probably most surprised by how well stocks have held up in this environment. Let’s see if this continues. Interesting no?
What do you guys think?
Tags: $SPY $UUP
New all-time high close for the S&P500 today. So in honor of this momentous occasion, Phil and I are joined by the man, the myth, the legend himself Mr. Ryan Detrick.
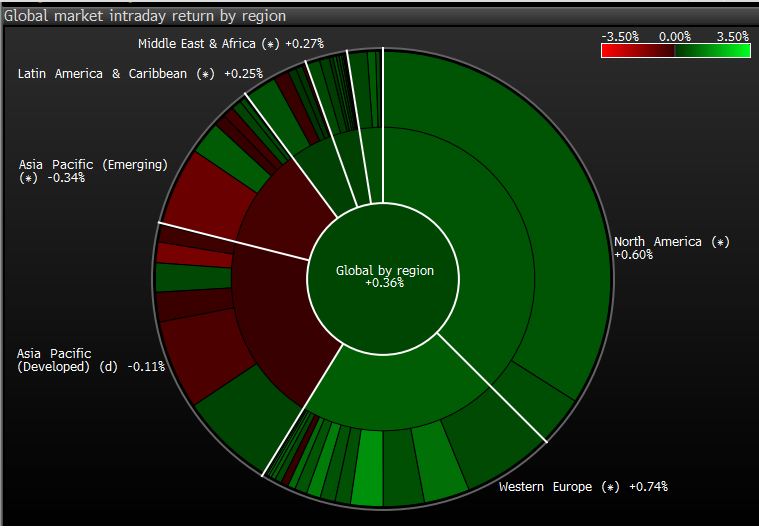
We discussed Consumer Stocks, Sentiment, Treasuries, UK breakout, Coal, Latin America and Europe. Check it out:
Source:
Hanging Out With Detrick & Pearlman
Tags: $EWU $SPY $EPHE $TLT ZB_F ZN_F $TNX $ILF $FEZ $KOL
US Treasury Bonds aren’t sexy. Trust me, I know. But neither were Staples and Healthcare for a long time right? And now, what’s hotter than a Johnson and Johnson, P&G, or a Coca-Cola? I almost can’t even say that with a straight face. But these are the names getting the attention these days, no question about it.
So when we think about US Treasury Bonds, we should at least give them a chance. With that said, let’s reflect for a minute and think about what just happened over the last 10 months. Last summer the world was ending, Greece was done, Eurozone was splitting up, Fiscal cliffs, debt ceilings, Elections….the media came up with every possible reason why we should sell stocks (see here). Well? We got a monster rally instead. Stocks did great. The more speculative the better actually, until just recently. But forget stocks for a minute. What about bonds? What did US Treasuries do during this 25% move in the S&P500 (30% for the Russell2000 and Mid-Cap 400)?
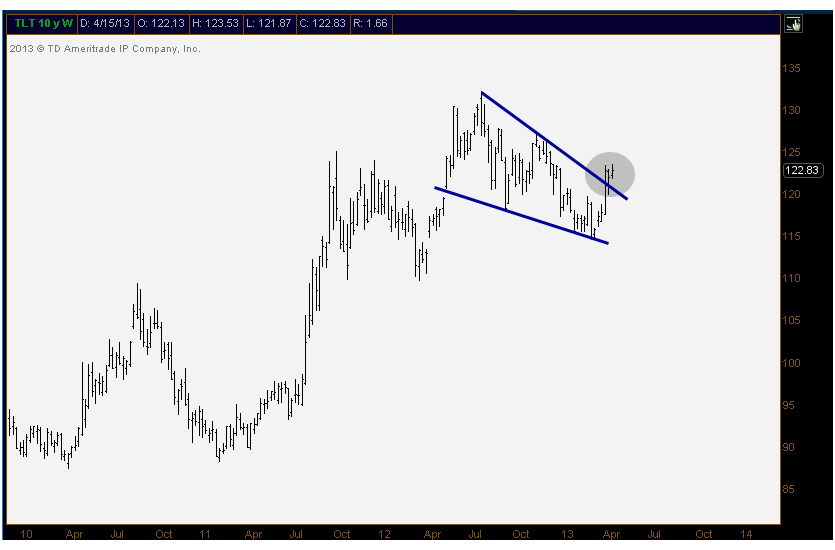
Bonds consolidated nicely. You couldn’t possibly have asked for better action out of this negatively correlated asset class. Here are two ETFs that I think tell the story well. Under market conditions where speculation ruled (in theory), the safe haven held its own. Here is a weekly bar chart of the iShares Barclays 20+ Year Treasury Bond Fund $TLT. Call me crazy, but this looks to me like your standard falling wedge within an ongoing uptrend:
And here is the shorter duration equivalent. $IEF is the iShares Barclays 7-10 Year Treasury Bond Fund. In this case, the upper and lower borders of the consolidation are parallel, forming more of a flag than a wedge, but the consequences are the same.
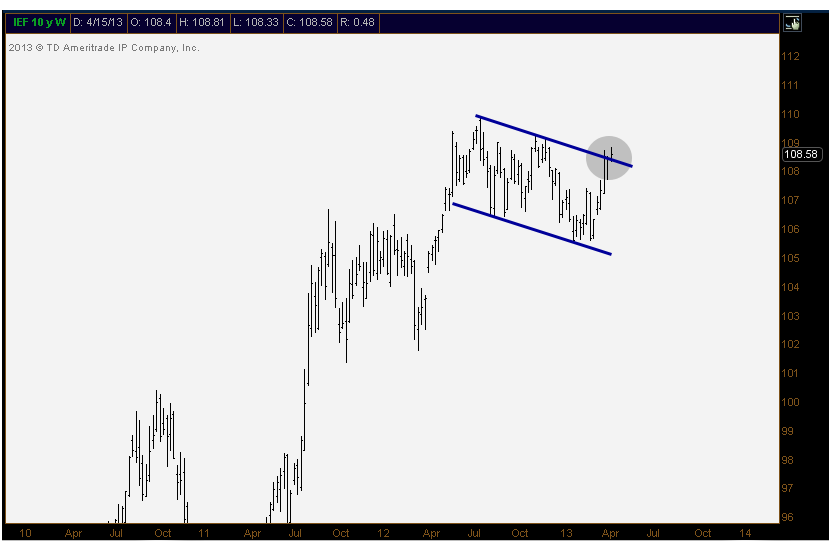
These look like two continuation patters to me. Obviously the breakouts in each of these have to hold. Last week we suggested that Bond yields were breaking down and this certainly ties in with that. I’m very impressed with the health in Treasury Bonds during this last leg of the US Stock Market rally. So I think to err on the bullish side of bonds right now is warranted. I keep hearing about this secular “Great Rotation” out of bonds and into stocks. I’m sure it gets clicks and sells newspapers. But as always, we’ll look to price action to help us determine what’s rotating and what isn’t.
I’ll do my best to circle back and reevaluate this market again on the blog in a couple of weeks. But right now, it’s hard not to be encouraged by the action in government bonds.
Tags: $ITF $TLT $TNX $ZN_F $ZB_F
Something that I think is worth noting here is what’s happening in US Treasury Bonds. With Gold breaking those key support levels we mentioned last week, precious metals are the ones getting all the attention. But how is all this volatility in commodities going to affect stocks and bonds?
This is a daily bar chart of US 10-year note yields. After trading within a fairly clean uptrend channel from last summer, it appears yields are attempting to break down here:
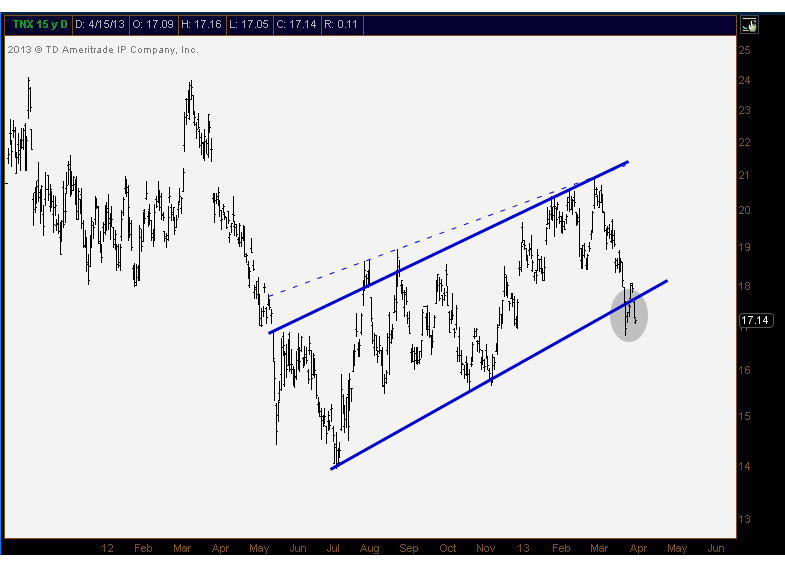
Government bonds prices rallied hard at the end of last week. I also don’t see them getting much attention. All everyone wants to talk about is gold and silver. I mean, they’re a lot sexier than Treasury bonds right?
Either way, there are definitely some interesting developments in government bonds, at least from where I’m sitting. Stay tuned.
Tags: $TNX $TLT $ZB_F $ZN_F $TBT
There are some important breakdowns taking place that I think are worth nothing. Two areas that I consistently look to for direction, Copper and US Treasury Bond Yields aren’t looking too hot these days. I don’t think it’s a secret as Copper has been selling off relentlessly since Super Bowl Sunday. But treasury yields are now vulnerable too, adding to the divergence between risk assets and US Stocks.
My pal Chris Kimble sent this to me Sunday night:
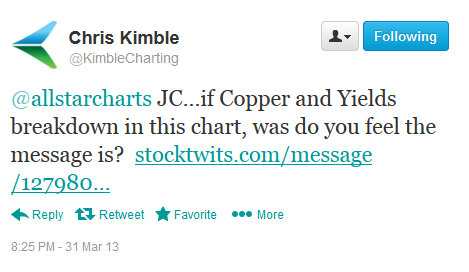
Here are the charts he sent along with his message. As you can see, both Copper and Treasury bond yields (30 & 10 yr) appear extremely vulnerable (click charts to embiggen):
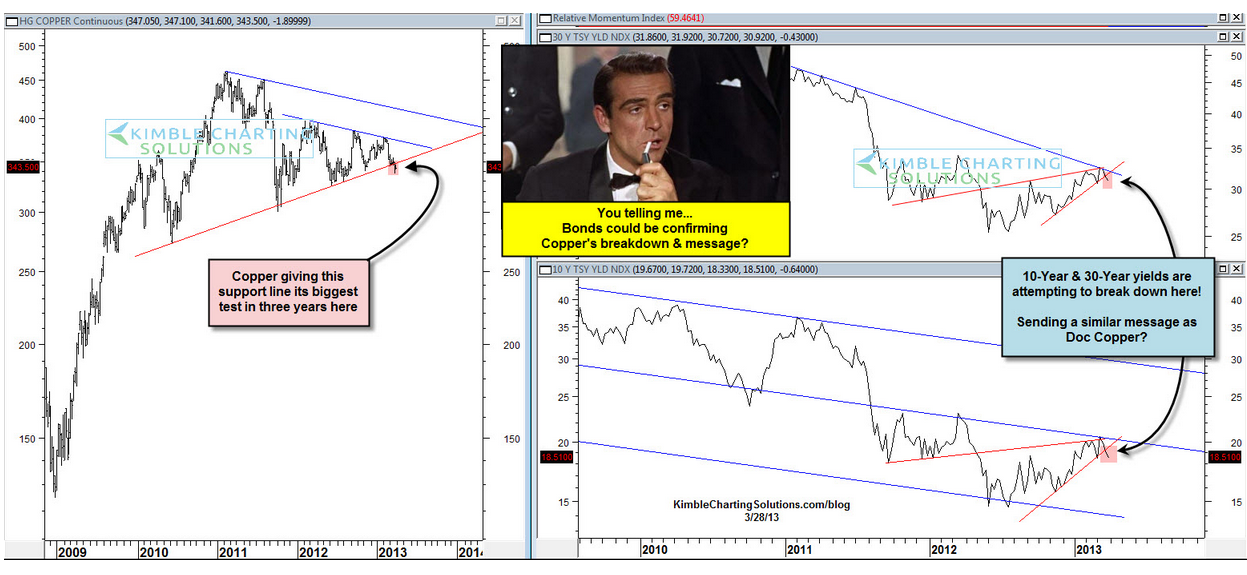
And my answer to his question – What do I feel the message is? – I think it’s telling us to be careful. Very careful.
When it comes to US Stocks, I certainly have been over the past month. And US Stocks keep roaring higher telling me that I should have been leveraged long $SPY instead of picking and choosing where to be. And I’m okay with that. If my biggest mistake in the portfolio is erring on the side of caution, I’m okay with that. There are times to be crazy aggressive long (see here), and there are times to be extra careful. And right or wrong, I think this is one of those times.
So for now, we’ll stick with what we’re doing: selling any strength in Europe and most emerging markets, and picking and choosing where to be in the US. There are also other areas around the world doing well (like Indonesia) and areas acting poorly like Latin America. So sure, the message from bonds and Dr. Copper is to be extra careful. So we’re listening. And I think we all should.
*Make sure you’re following Chris Kimble on Stocktwits and Twitter @KimbleCharting – excellent technician. Been reading his stuff for a long time. Here’s a link to his blog: Kimble Charting Solutions.
Tags: $HG_F $JJC $ZB_F $TLT $TNX $IDX
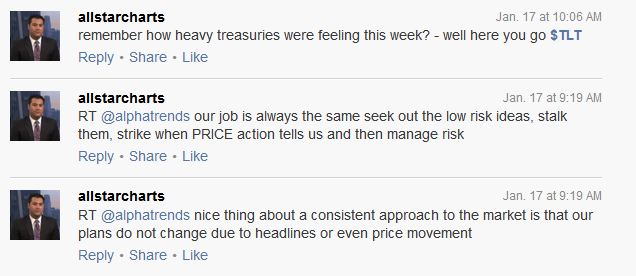
Trading floors don’t exist anymore. I don’t care what you see on TV. I’ve been to all of them and there’s no one there. The few people left are playing on their iPhones showing others how funny their recent tweet was or watching youtube videos about leprechauns. There’s no such thing as looking at your competition in the eye to see what’s going on. The camaraderie that comes along with hanging out with traders all day is also lost. The joking around and trading idea sharing is history.
That’s where Stocktwits comes in. The new trading floor, if you will. You can filter to see just who and what you want. And if you don’t like something or someone, ignoring is made simple. There’s no “block” button in real life unfortunately, but very easy to do on Stocktwits. Over the years I’ve met some brilliant and very cool people on the stream that I’ve later hung out with in the real world. It’s pretty awesome.
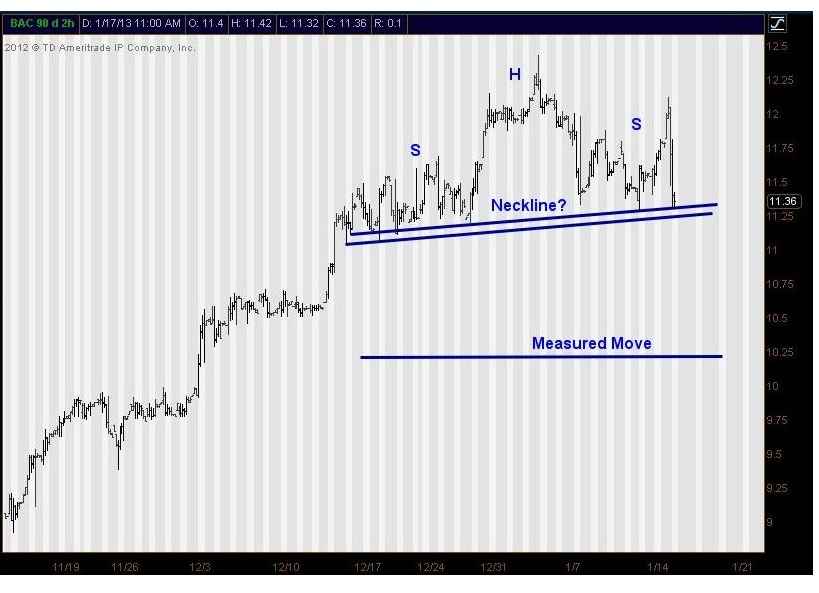
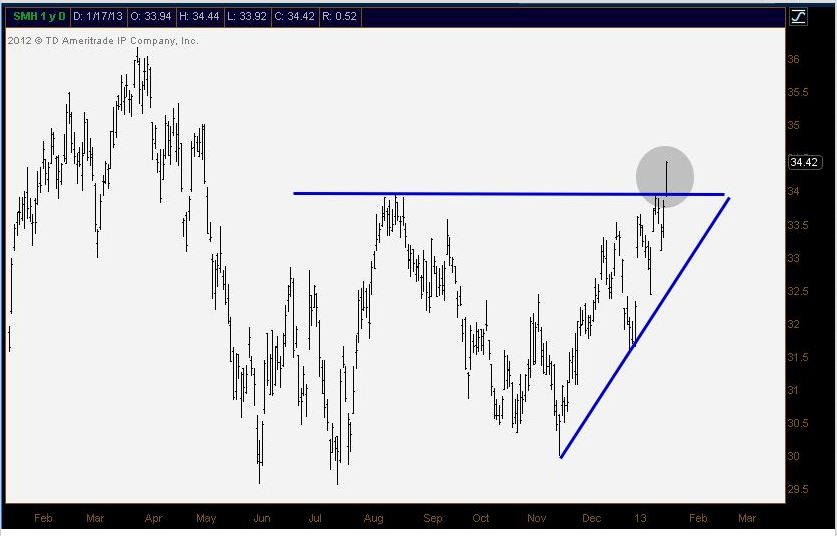
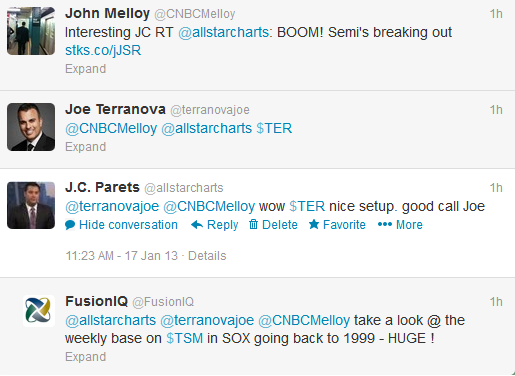
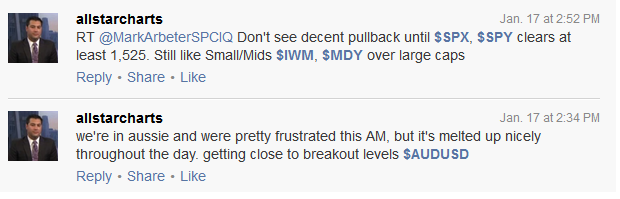
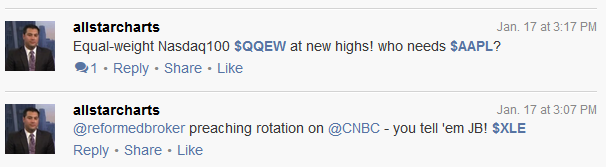
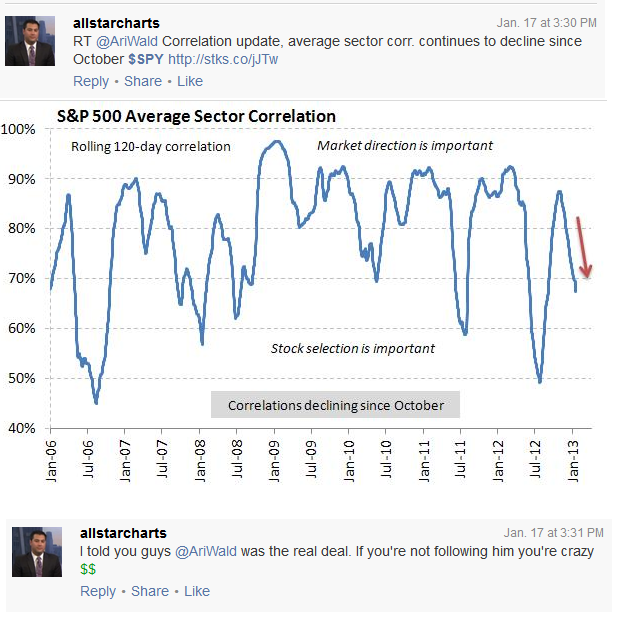
Thursday was a busy one for me. Much more tweet-filled than usual I think. So rather than writing a post about something I’m seeing out there, here’s a summary of what we were discussing throughout the day:

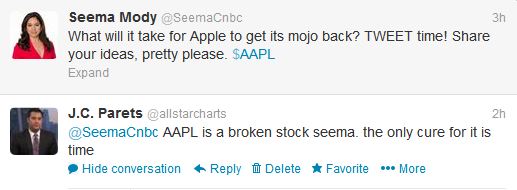


Another one in the books…
Follow me on Stocktwits and Twitter @allstarcharts
Tags: $CL_F $USO $TLT $ZB_F $CAT $AAPL $APC $BAC $SPY $TER $SMH
This is the question that we like to ask ourselves when we look at the US Bond market. Would we prefer to be heavier on the government debt side or higher yielding corporate bonds (“Junk”)? Logic would probably tell us to be in the junk while rates keep heading higher. And that strategy has actually been working nicely for some time now.
But what do we do from here? – that’s the question. This is a chart of the iShares High Yield Corporate Bond ETF relative to the iShares 20+ Year Treasury ETF. As we can see, the 50% retracement from the 2011 decline has been trouble for over a year.
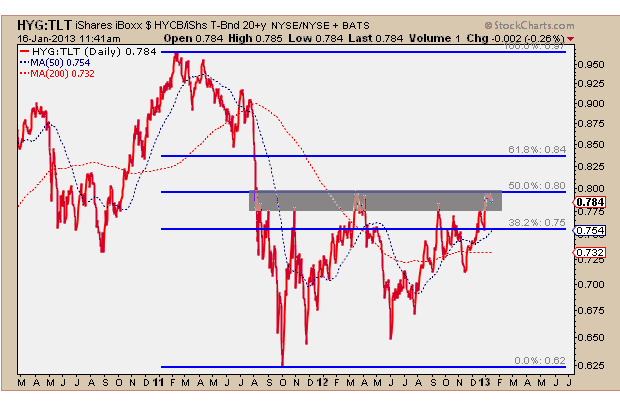
So I would be watching this 80 area closely on the spread as Treasury Bond prices continue to come off. I think it would be healthy to see a little bit more consolidation before breaking out, but as always, the more times a level is tested, the higher the likelihood that it breaks. And this looks like test #4 on my count.
Stay tuned…
Tags: $TLT $HYG $JNK $TNX $ZB_F