With all the noise surrounding the recent sell-off in the U.S. stock market, it can be easy to forget that there are some areas of the market doing much better than others, and there is a lot of money to be made in the widening of those spreads. This is where intermarket analysis and ratio analysis can really become profitable for a portfolio. Today we are looking at the biggest companies in America, as a group, breaking out to new highs relative to the smallest companies in America: the Micro-caps.
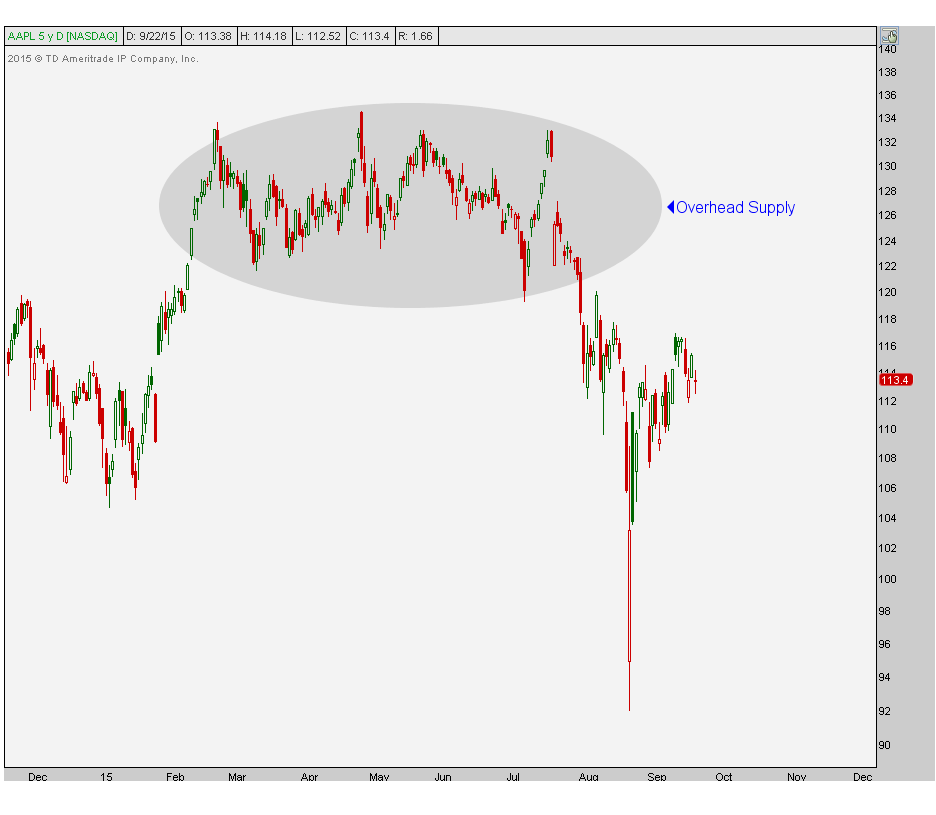
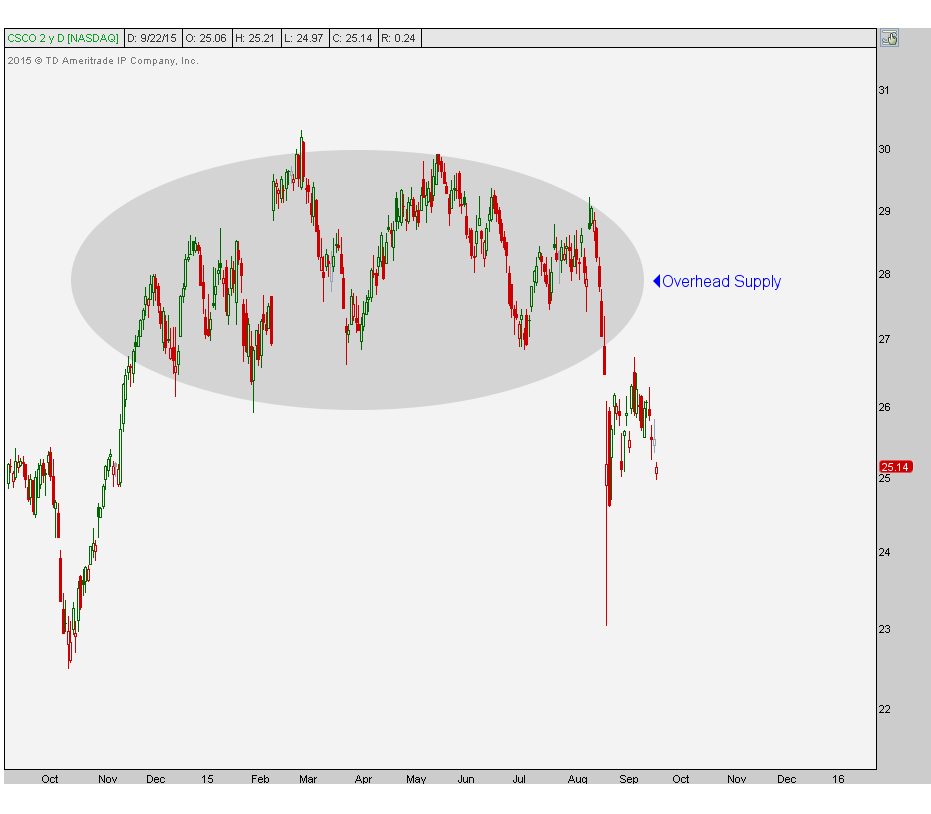
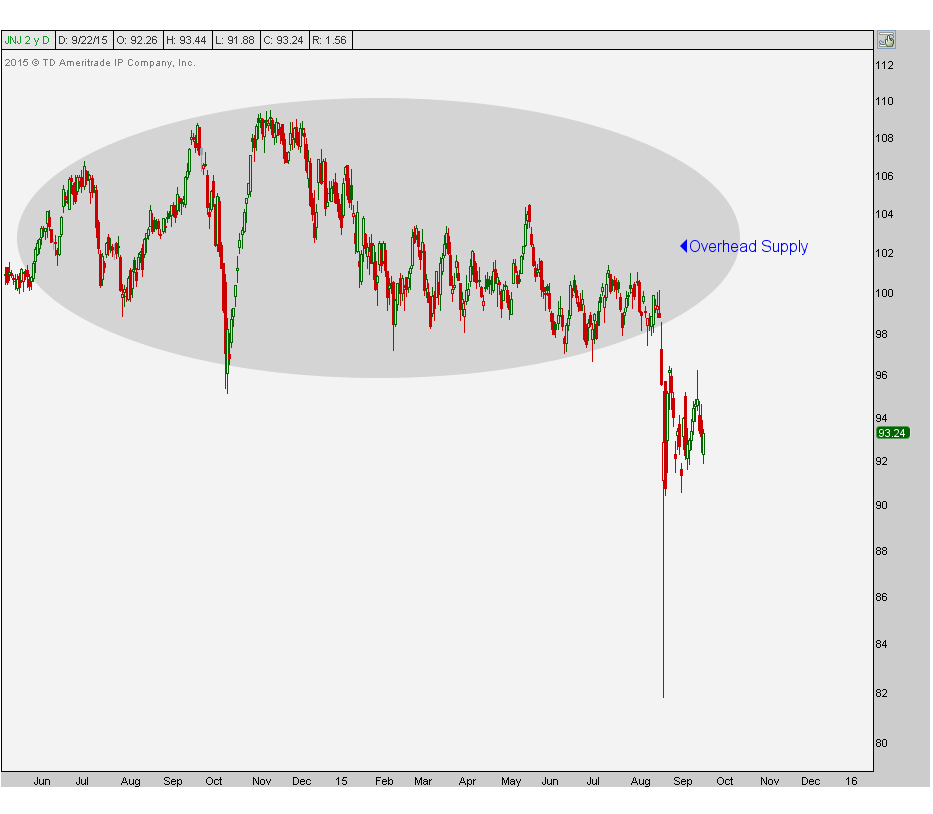
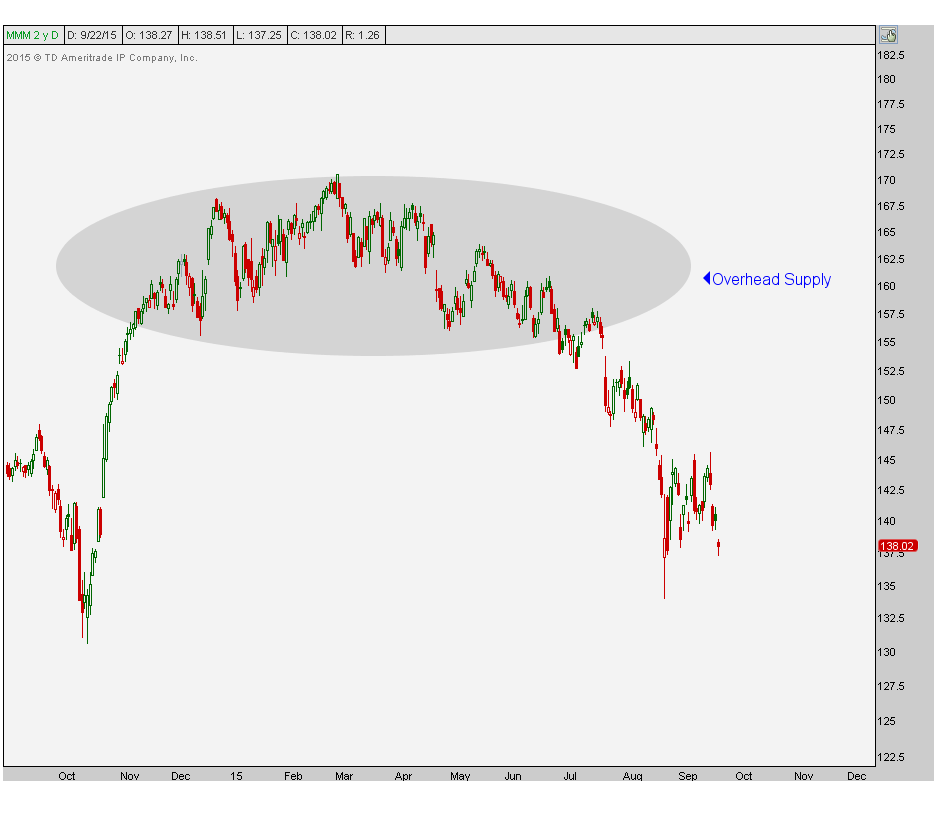
What this ratio tells us, as investors, is the direction of the flow of money. Are institutional dollars flowing into the riskier, smaller companies in the stock market, or is it going into the larger, more traditional, relatively safer segment of the market that is, the Mega-caps. To me, there is no better gauge out there for the Mega-caps other than the old Dow Jones Industrial Average. The 30 components that make up this Index are 30 of the largest companies in America: Apple, Microsoft, Exxon, JNJ, General Electric, etc. When we compare this group to the Russell Micro-cap Index, we get a very clear picture of the direction of money flow.
Here is a 10 year chart [Read more…]