This weekend I did my regular global macro review. This is when I go country by country analyzing the weekly and daily charts of all of the stock markets around the world. Each chart includes a momentum study (14-period RSI) and a 200 period moving average that we use to help with trend recognition. I trade indexes all over the world, simply because I can. Why wouldn’t I? [Read more…]
[Premium] Why Global Markets Are Signaling A Squeeze Higher
Going country by country all over the world is one of the best tools that we have as market participants. The value that I’ve gotten over the years from looking at the behavior of all of the countries, instead of just the U.S. is a huge factor in why I am such a top/down weight-of-the-evidence guy. There are signs of strength and weakness that we see from international markets that might not be so obvious in the S&P500, for example.
Last September, I promise you that the reason I got bullish tactically was not because of what I was seeing in the United States, but what was happening around the world. There were simply too many bullish momentum divergences and downside objective achieved internationally to ignore. Something was up, and in fact, the counter-trend rally that we got in the U.S. actually exceeded my expectations.
The Relative Strength in Belgium and Switzerland Stands Out
One of the more valuable tools that we have as market participants is Relative Strength. Where are the weaker areas of the market and where are the stronger ones? This concept can be seen among individual US Sectors. For example Financials have been laggards while Healthcare has been a leader. You can take that one step further and look at the relative strength out of Wells Fargo, while Citigroup has been one of the worst names in the Financial sector. But as you guys know, I like to take my analysis globally and look for relative strength among different types of countries and regions. India this March really stood out when compared to the other BRIC nations (see here). While Russia, Brazil and China were breaking to new lows, India was breaking out to new highs. I simply can’t call it a coincidence that India then rallied 35% from March while the others continued to struggle.
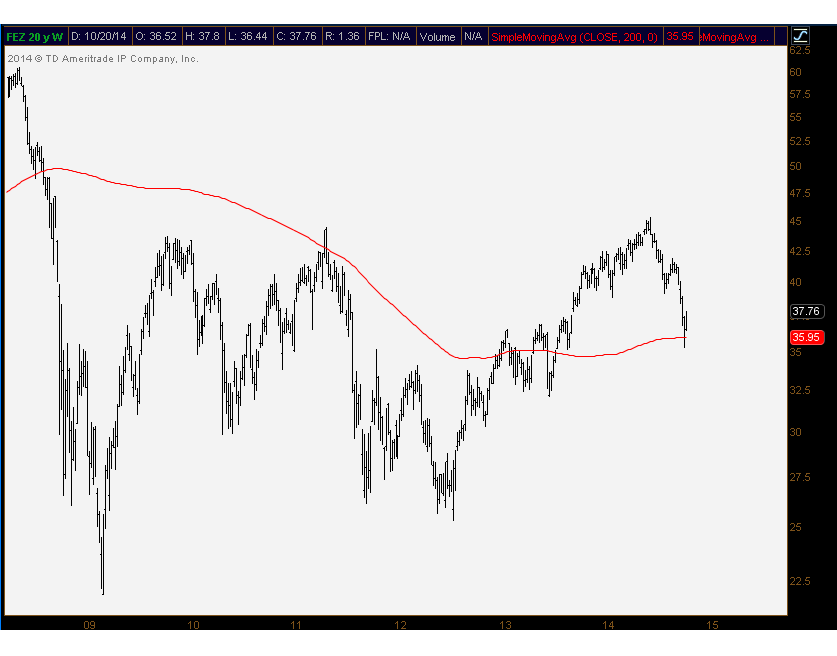
Today we’re taking a closer look at Europe. Members of Eagle Bay Solutions receive a much more detailed report of Europe every week that also includes the rest of the countries around the world on multiple timeframes with additional momentum analysis and price projections. I wanted to share with you guys just a few simple charts from Europe comparing some of the laggards to these two leaders: Belgium and Switzerland. What stands out to me is where these two countries are relative to their 200-week moving averages. From a structural perspective, all of the European nations tested or briefly broke this particular long-term smoothing mechanism. These are all 6 year charts. Notice the differences:
Here is the Euro Stoxx 50 $FEZ representing Europe as a group breaking the 200-week moving average:
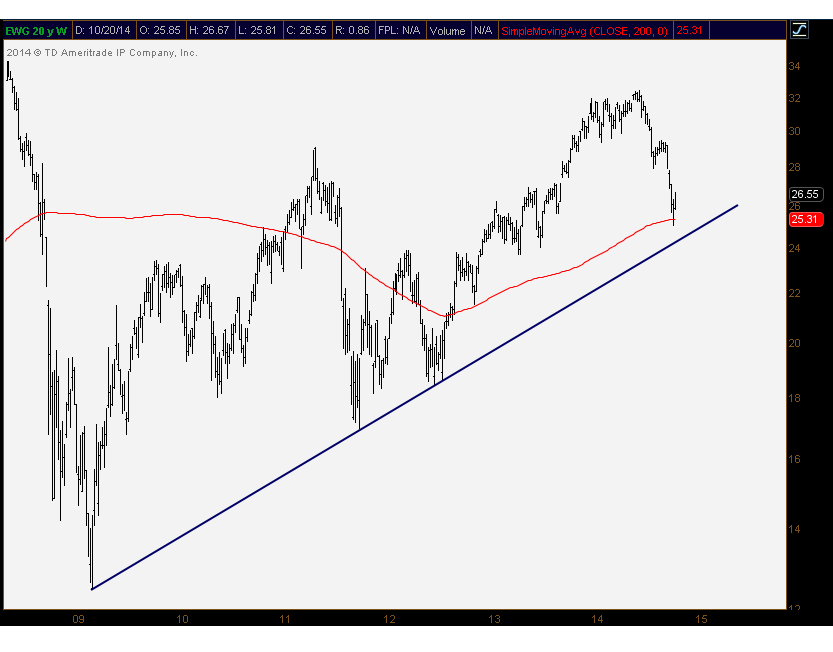
 Germany $EWG did the same thing:
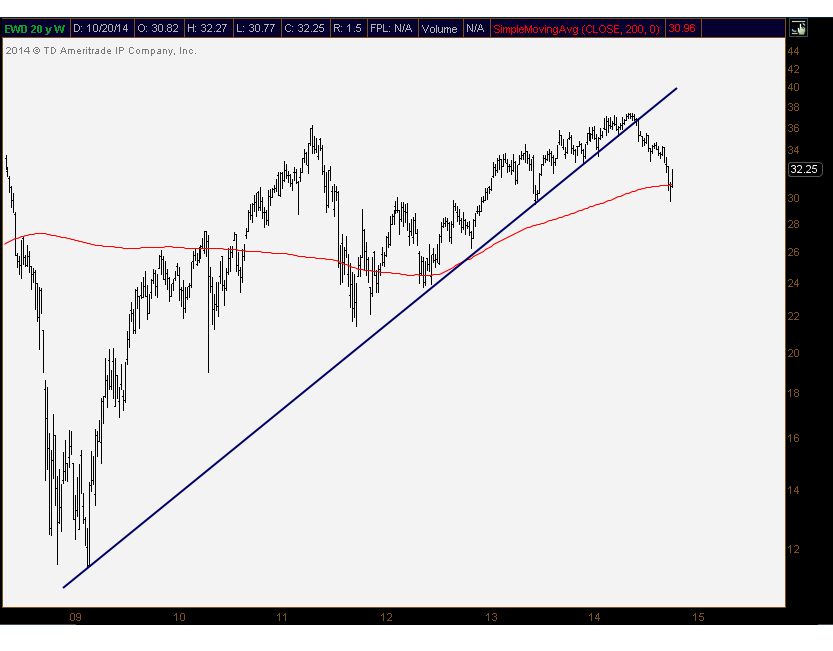
 Sweden $EWD Broke the 200-week:
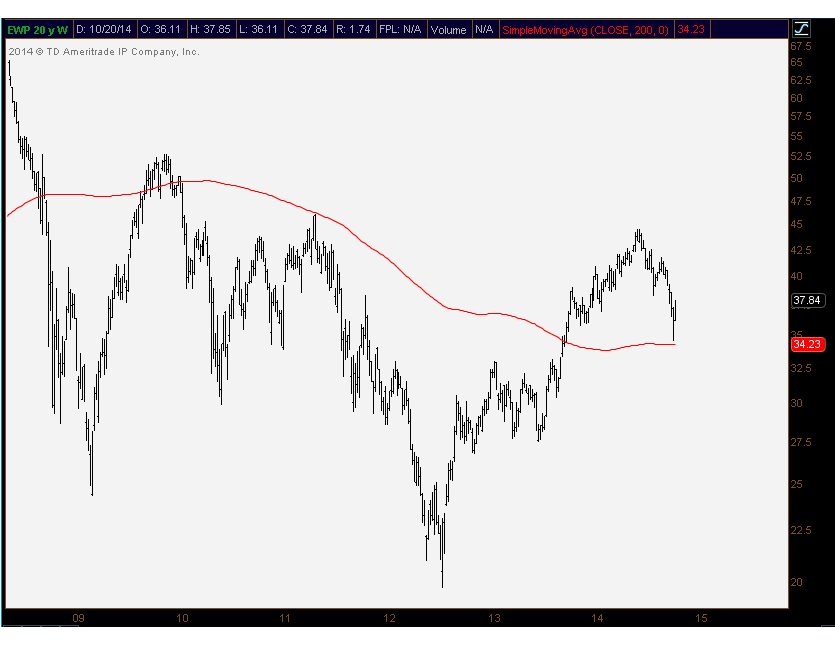
 Spain $EWP got down to the 200-week and is structurally one of the worst in Europe:
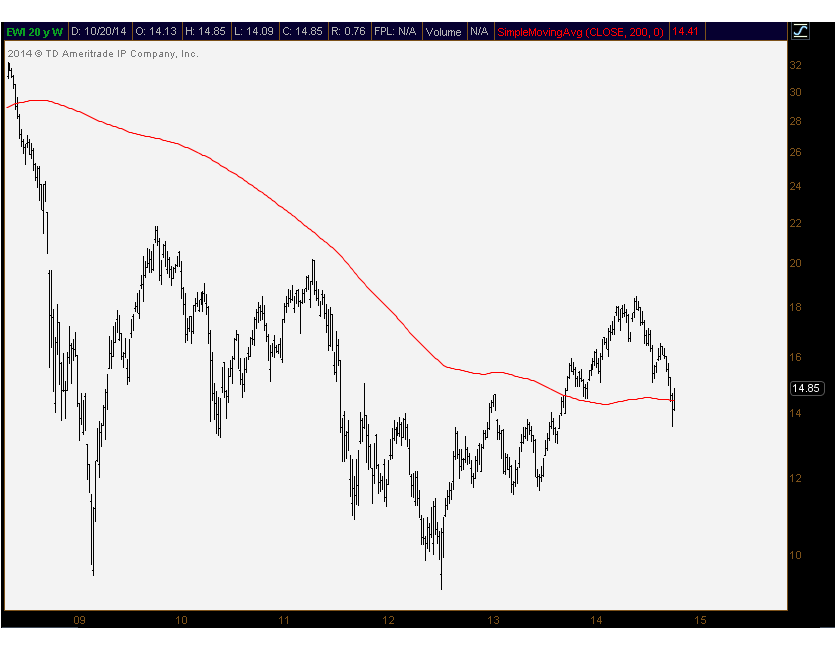
 You can group Italy $EWI in the same category as Spain:
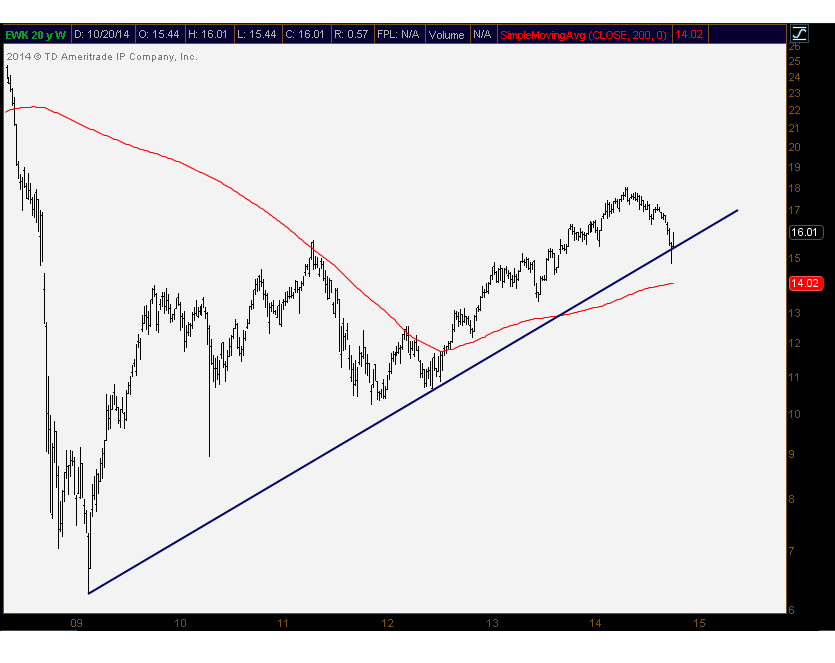
 Now look at Belgium $EWK hanging in there much better relative to this particular long-term smoothing mechanism:
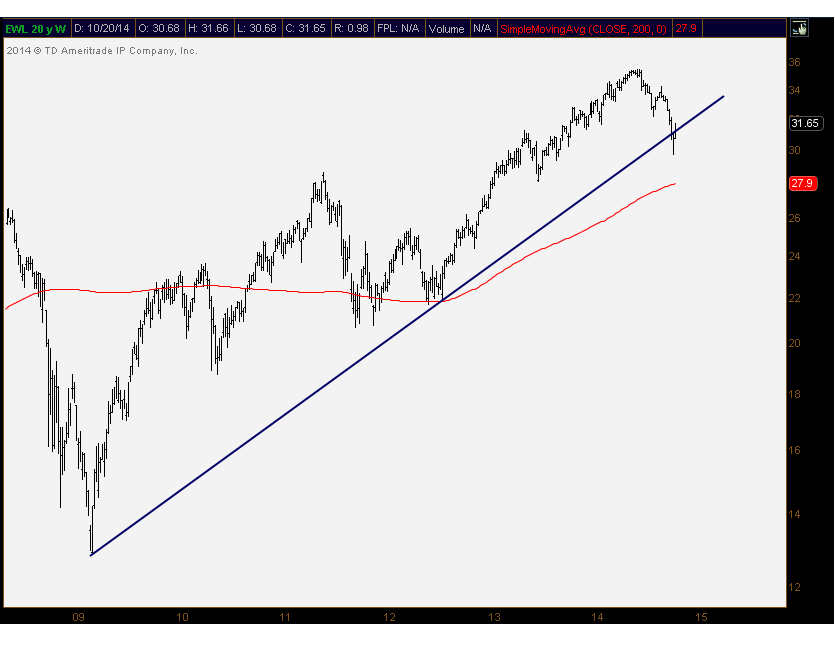
 And Switzerland $EWL holding up as well:
Going through each of the individual country ETFs in Europe, these two in particular really stand out. It could be nothing. Or we can look back 6 months from now and say, “oh wow that was the tell”. I guess we’ll see. But either way, I think this is a good exercise regardless of the asset class or group of stocks or ETFs that we’re analyzing. I think there’s something here. Maybe they hold up better if stocks continue to struggle as they have been throughout 2014. Maybe on the next rally these are the outperformers. Maybe there are some good pair trades where these two can be the numerators while the laggards are on the short side of the pair. Execution-wise, it really just depends on your goals, time horizon and risk tolerance. But once that is defined, I think this can be a good starting point.
Make sure you’re on the weekly distribution list and receive updates on all of these charts along with more tactical daily charts, momentum analysis, relative strength, pattern recognition, support & resistance levels, Fibonacci projections and risk management procedures.
Here is a special offer that we extended for a couple more days:

Click here for more information on Managed Assets
Tags: $EWI $EWP $EWG $EWK $FEZ $EWL $EWD
Pairs, Pairs, They’re Good for Your Heart
Before the 62,197 articles and blog posts get written about this market correction, let me throw a few things out there. First of all, it’s nice to see this market pull back a bit. I bet there are a lot of “traders” turning into “investors” and waiting for their crack stocks to come back. If you’re one of those, you deserve to lose money and let this be a lesson. If you had your stop and got out, knowing your risk tolerance ahead of time, good for you. That’s the way it’s done.
With that said, here is the tweet of the day:
Every successful trader I know decides EXACTLY how much they’re willing to lose BEFORE entering a trade. $STUDY
— DarvasTrader.com (@DarvasTrader) June 5, 2013
It’s not about how much money you make. You can’t control how high a stock you just bought can go up, or how low a stock you shorted can go down. There isn’t any amount of home work you can do, or time you can spend starring at the screen that will help a stock do what you want it to do. It’s out of your control. The only thing you can do is limit the amount of risk that you take. That is literally the only power you have. So before we enter any order, we know almost to the penny, how much money is at stake, worst case scenario.
Alright fine, that’s great and everything, but now what? I mentioned on Friday that if 1635 S&P support was taken out, then I would expect some further consolidation, either through price or though time. I still don’t know which one of those two it will be but I am fairly certain it should be a healthy combination of both. So I think directional bets, both bullish and bearish, aren’t (and haven’t been) worth the risk. Whipsaws in both directions are probably the norm for now.
So the majority of our exposure, as it’s been for a few weeks, is in pairs where we have the same amount of money in a long as we do in a short. Not all of these will work, but they will be much less affected by ups and downs in the S&P500 than an outright long or short. We mentioned a few pairs that have been working in a recent blog post. But some have not been. Last Friday, Phil and I discussed a pair that we started putting on where we went long Biotechs and short Staples against it. As well as that looked closing out the week, it smacked us right in the face and we’ve gotten out and moved on. It happens. And it will happen again. But risk tolerance right? See Paragraph 1.
Outside the US, there are a few pairs around the globe that we’ve put on that have been working so far. And they don’t have any significant correlations with S&Ps either. For example, we’ve been long Poland and Italy, while being short France and Switzerland. Out in the pacific, Malaysia is making new highs against Singapore and New Zealand is making new highs against Australia. And there are other crosses out there working that we don’t have on but are watching closely.
Within the US there is plenty happening as well. But obviously I can’t share everything that we’re doing. And the point of this post isn’t to talk up my book. It’s to point out that when markets get discombobulated (yes that’s a technical term) there are plenty of opportunities out there: outperformances and underperformances to take advantage of. So think of this as, not me telling you what we’re doing, but more as a reminder that the US Dollar doesn’t always have to be your denominator. In other words, there is opportunity risk, as well as market risk (especially in this sort environment) by not have another side to a trade
Just my two cents….
You can go carry on with your “market goes up every tuesday” articles or whatever it is you’re reading these days.
I’m going to go mentally prepare for my NBA Finals Game 1 tomorrow….
Tags: $EPOL $EWI $EWQ $EWL $ENZL $EWA $EWM $EWS $XBI $XLP