Is this market fun or what?
Dr. Phil and I did a short video where we discussed S&P levels, Treasuries, Emerging Markets, Copper, Brazil and China. Check it out:
Tags: $FXI $TLT $ZB_F $DX_F $EEM $HG_F $IYR XLU $EWZ
Expert technical analysis of financial markets by JC Parets
Is this market fun or what?
Dr. Phil and I did a short video where we discussed S&P levels, Treasuries, Emerging Markets, Copper, Brazil and China. Check it out:
Tags: $FXI $TLT $ZB_F $DX_F $EEM $HG_F $IYR XLU $EWZ
I hate to keep harping on the same topic – this emerging markets disaster. But I think there’s something else here worth mentioning, and then I promise I’ll leave it alone. John Murphy brought up a great point yesterday in that the six month correlation between US and Emerging Market stocks has been consistently positive for years. Any slight divergence between the two gets adjusted quickly by the market and immediately shoots back up towards one.
As you can see in this chart, correlations are plummeting. The weekly bars represent the S&P500 and the red line shows the Emerging Markets $EEM. The 6-month correlation is plotted at the bottom and takes us all the way back to the 2008 global sell-off.
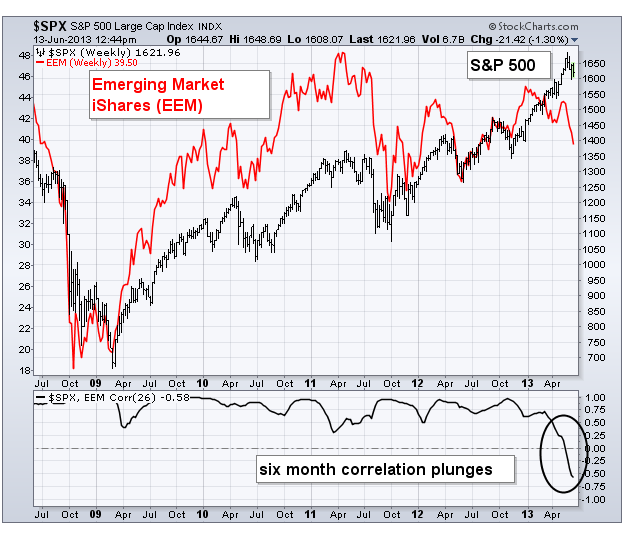
So here is the question: Is this a new normal? Are US Stocks no longer going to be trading with Emerging Markets? These are two different worlds now and just something we need to get used to? Or is this a temporary divergence that will quickly be corrected by Mr. Market? And if so, will US Stocks come down, EM come up, or a combination of the two?
Related Posts:
Is This The End Of Emerging Markets Underperformance (June 11, 2013)
How Does Your World Look This Year? (June 12, 2013)
Source:
John Murphy Market Message 6-13-13 (StockCharts)
Tags: $EEM $SPY
I think people are starting to catch on that most of the world has been a disaster this year outside of the US, Japan, and maybe Europe. We’ve recently seen a 5% correction in the US and a 16% correction in Japan. But meanwhile, most of the world has just gone on to make lower lows. That rotation into the emerging and more commodity sensitive areas of the world just hasn’t occurred. They keep selling them.
Below is a year-to-date performance chart showing how bad it’s gotten this year in the Middle East, Africa and Latin America. We’ve seen some heavy selling out in the Pacific the last few weeks, and this is outside of Japan. Canada’s mining and commodities exposure has hurt them as well, keeping them in the negative for most of 2013:
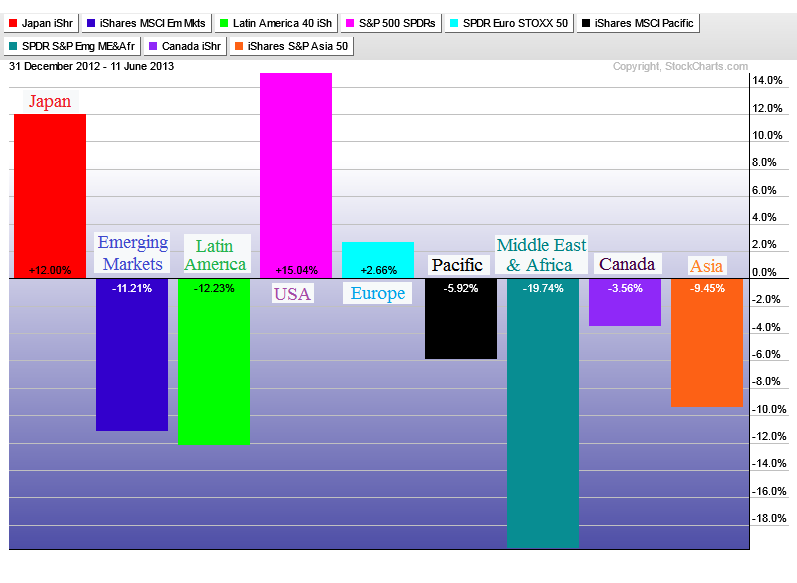
So are the US and Japan starting to play catch-up to the rest of the world? Is money going to finally flow into these underperforming areas for the first time all year? Or are we just going to keep seeing this disconnect? What do you guys think?
Tags: $EWC $GAF $SPY $EWJ $EPP $AIA $ILF $EEM
I’m not so sure. This seems to be a big topic of conversation today. But I’m still not convinced that it’s time. Can they bottom out here relatively? Of course. But to me, if they do it would be coming at a pretty random area. However, let’s try to stay objective and look at just prices.
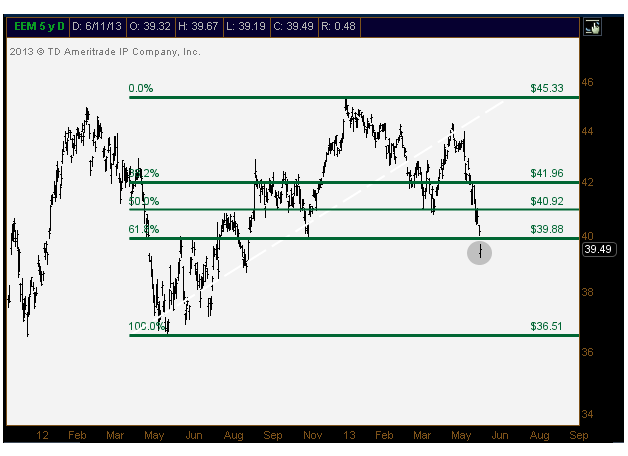
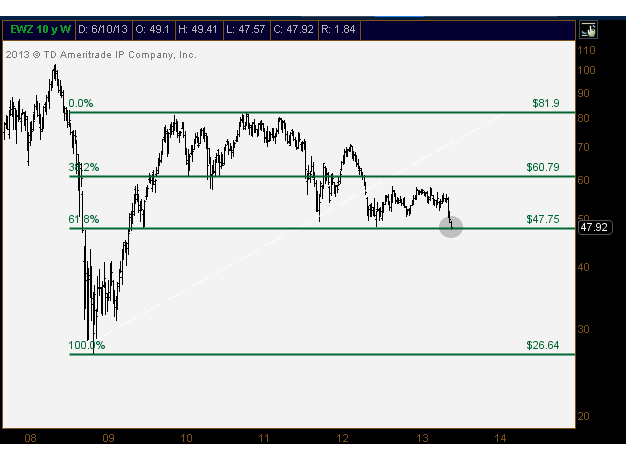
The first chart is the Emerging Markets ETF ($EEM). Tuesday morning’s gap lower took this below some key support levels that include last year’s November lows and the 61.8% Fibonacci retracement off the summer lows. If this is the bottom in $EEM then hey, what can I tell you? It came at a random level and I just missed it. I suppose you can come talk to me if we’re back above $40. Perhaps then maybe I can be convinced that they might be a long:
Now on a relative basis, I’d be lying if I didn’t say there were some interesting developments. We’re really pushing it here, but the $EEM:$SPY chart is meeting a few trendlines coming from different directions. On a daily closing basis, we’re approaching the uptrend line that takes you back to the 2006 lows (blue dotted line). You can also make the argument that the lows line up from this multi-year down trend. But again, I really think we’re pushing it.
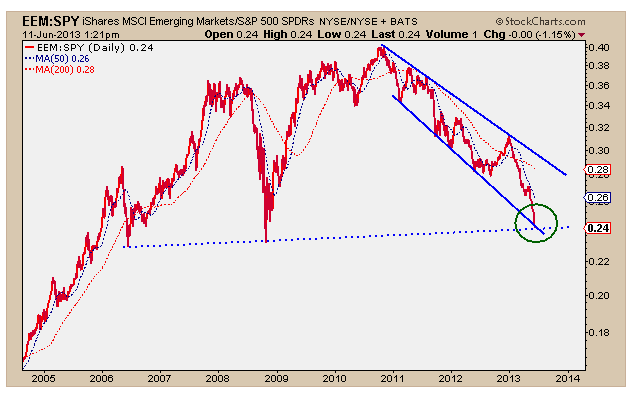
I suppose on a relative basis, the risk/reward here isn’t horrible. But on an absolute basis, EEM is tough to get involved with, at least for right now. I guess we’ll see how this week closes up and we’ll decide then. It’s just not for me right now.
The last chart is Brazil. If you had to pick one emerging market that is at an area where you might want to give it a shot, I guess it’s the beat up Brazil. Prices are near the 2011 & 2012 lows and still holding the 61.8% Fibonacci retracement off the low lows of 08. But again, nothing that I’m in love with.
That’s how I see EM right now. I wish I had more conviction. But it’s just not there. What do you guys think?
Tags: $EEM $EWZ $SPY
Phil Pearlman and I had a nice little chat after the close on Friday. This week we focused more on longer-term weekly price charts and internals. Check it out:
Tags: $SPY $FEZ $FXI $ILF $TLT $ZB_F $TNX $SMH $SOX $EEM
My buddy Joe Fahmy was nice enough to have me over to his office this evening to chat about the markets. Since we have the technology, we figured we should record it. Here’s how the video came out:
Make sure to follow Joe on Stocktwits & Twitter @jfahmy
Also check it his blog The Next Big Move
Tags: $FEZ $EWG $EWQ $EWD $ILF $EWW $EWZ $EPU $GXG $EPOL $DXJ $EPHE $EWM $EIDO $EEM
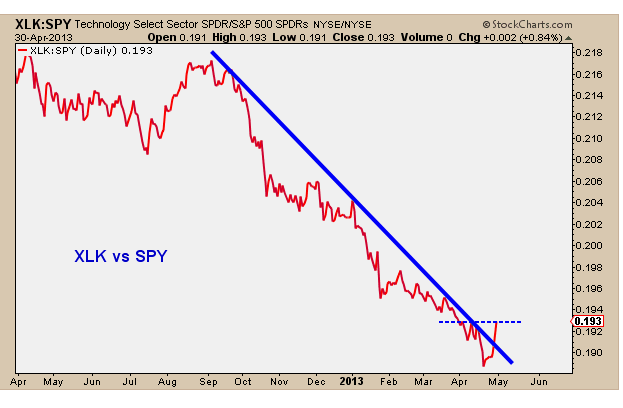
There are a couple of underperforming areas that have caught my attention this week. One of them is technology and the other is emerging markets. These two have been serial underperformers for a while now. When the Apple bubble popped in September, its outsized weighting has dragged the tech space down ever since, specifically on a relative basis. Emerging markets peaked on the first day of the year and have been trading lower for 4 months, both on an absolute basis and relative to S&Ps.
The two charts I have today are ratios against the S&P500. The first one is the SPDR Technology Sector ETF ($XLK) vs the S&P500 ETF ($SPY). This ratio has been getting crushed since the September peak in $AAPL, but is just now trying to turn the corner. The spread has finally broken its downtrend line and is now working on making its first higher high:
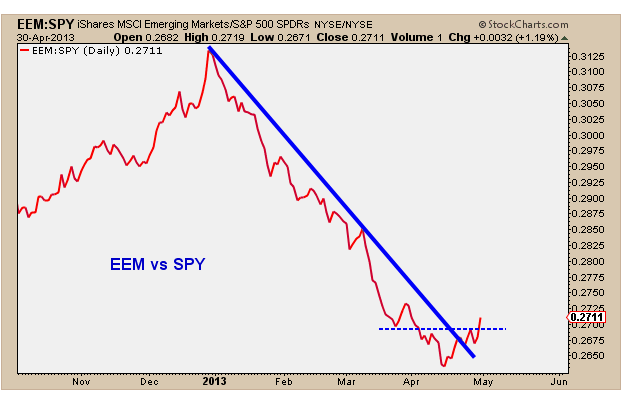
The second chart is the iShares MSCI Emerging Markets ETF ($EEM) vs the S&P500 ETF ($SPY). Same thing: big long downtrend, this time since December, just now breaking its downtrend line and attempting to make a higher high:
Now, something important to keep in mind is that just because a trendline is broken doesn’t mean that the trend has reversed. Generally we can expect that at least a sideways market should ensue. Whether these two markets actually reverse and begin heading higher is still up in the air. But I think these trendline breaks along with positive momentum divergences are definitely worth noting.
This goes back to whether or not the institutional money is rotating back into the underperforming areas of the market. There are two schools of thought: One of them is that since Defensive areas have led this year, while tech, materials and really anything “global growth” related has underperformed, this is a sign of trouble ahead. But the other view would argue that money can flow back into these underperforming areas, sending major market averages even higher. Two of these areas are Tech and Emerging markets. You can argue that if EM heads higher, materials and industrials should follow as well.
So these are really two key areas that we want to watch here short-term.
Tags: $XLK $SPY $SPX $EEM
Tuesday night I had the pleasure of attending this month’s New York Chapter meeting for the Market Technicians Association. Chris Verrone, Head of Technical Analysis at Strategas, was this month’s guest speaker. I wanted to share a few things he brought up that I think are important.
First thing is that he seemed extremely bullish on US Equities. Verrone isn’t a big fan of price targets, which I can appreciate, but definitely on the bullish side. Although he admitted not being in the camp that this is the beginning of the next secular bull market for US Stocks, he pointed out that nobody thinks that. He asked the audience who believed we were already in the next secular bull, and 1 person raised their hand.
When talking about this recent move in the Nikkei, Verrone showed a plot graph comparing previous rallies in the Nikkei throughout history. And although everyone is in awe right now with what’s happening in Japan, the graph showed how normal this recent move has been. In fact, when compared to the up move between 2003-2007, this is really nothing. It’s not even close. Also he pointed out that he believes every single wall street desk missed this move. So there are still plenty of potential buyers out there that have not participated.
Treasuries were an interesting topic as well. He said that he has given this a lot of thought – whether the US Government was manipulating the bond market, and therefore some of the intermarket relationships. And he made some good points. Think about a big hedge fund, PTJ or Stanley Druckenmiller buying so much Intel that it drives it through resistance and to new highs. How this any different than what the US is doing with bonds? They are technically buyers right? So they are market participants at the end of the day. Valid point I thought.
I think that his process of analyzing the market makes a lot of sense. Verrone’s favorite habit is to rip though every single stock chart all at once. It usually takes him 5-6 hours. And when the pile of good charts is bigger than the pile of bad ones, he leans bullish. When the bad pile gets bigger, he gets more bearish. I definitely appreciate the simplicity of that thought process.
From a sentiment perspective, I agree with him that we should be a bit more creative than just looking at surveys. There’s a lot of noise when it comes to these things and they’re really much more valuable and indicative when they reach extremes. Newspaper headlines and general conversations are a great place to look as well. He pointed to the lack of bullish headlines lately as markets make all-time highs.
Within the US Stock Market, Verrone sees strength continuing to come from Healthcare and some of the insurance companies within the financial space. Although REITs have had a great decade, he’s a better seller than a buyer there these days. He also brought up a chart of how many times a specific stock is mentioned in news articles. Apple still rules although the stock has been crushed. He doesn’t see a bottom here and laughed at how many people stopped what they were doing last time they reported earnings to watch the screen for a few minutes. It reminded him of the OJ Trial and how everyone remembers what they were doing at that moment. I thought that was funny. Also Google, gets much less mentions, but is making all-time highs and coming out of a multi-year base. Symantec is another name bullishly coming out of a big base that he mentioned several times.
In the intermarket world, he admitted that the lack of strength in Aussie, Kospi and Copper was concerning. He didn’t really have a good answer to that, which is fair. I also asked him about whether the weakness in Europe and the 2013 downtrend in emerging markets bothered him at all. He had a great answer. He said, “listen, if you want to short China – short China. I don’t think that has any impact on Johnson and Johnson”. I can’t argue with that…
So all in all, I thought he gave a great presentation, as expected. If you’re in the New York area and would like to attend any future meetings, make sure to go check out MTA.org and sign up. Also if you have any questions, you can always reach out to me as well.
Tags: $JNJ $AAPL $GOOG $SYMC $NK_F $EEM $HG_F $AUDUSD $XLV $TLT $SPY