From the desk of Thomas Bruni @BruniCharting
***
The financial sector of the S&P 500 has been a major laggard over the last few years and 2016 is no exception with the sector down roughly 6% YTD.
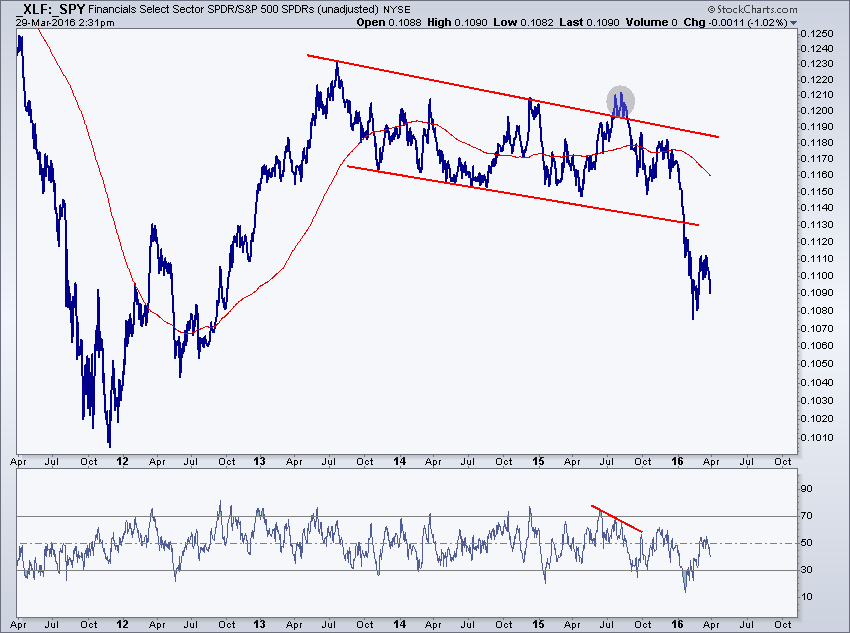
The five year daily ratio chart of XLF / SPY represents this relationship. This ratio broke down out of a multi-year downtrend channel while momentum confirmed a bearish range by moving into oversold territory. These conditions, combined with the presence of a downward sloping 200 day moving average, suggest that the under-performance of financials relative to the broader market is likely to continue.