One of the more interesting scenarios across the global market place is what is happening in the US Dollar, and the Euro component more specifically. Remember, the Euro represents a majority in the entire US Dollar Index. On Monday, the Euro engulfed the prior 13 trading sessions. This means that it made a new low, below the past few weeks trading, and then reversed to close at a new high, above any of the highs over the past few weeks. [Read more…]
[Chart Of The Week] Is This US Dollar Breakout The Real Thing?
I like to keep an open mind. The one thing I’m certain of is that I’m not certain of anything. So I weigh all of the evidence and then try to find the best risk vs reward opportunities based on the cards that we’ve been dealt. We can’t let our emotions impact our decision making, it has to be 100% dependent on the data at hand. Today, I think one of the more interesting situations is in the US Dollar Index. [Read more…]
[Premium] Weekly Open Letter About The Current Market Environment
In this week’s members-only letter we discuss the following topics:
- S&P500, DJIA, Nasdaq100: Buy, Sell or Hold?
- What Is The Best Way To Invest In The Chinese Stock Market?
- What Other Asian Countries Should We Be Buying?
- Which Commodities Are The Next Ones To Rip Higher?
- With Interest Rates On The Rise, How Do We Profit?
- Why Is Dollar/Yen The Most Important Chart For U.S. Stocks?
- What Other Currencies Do We Need To Own Today?
A Look At The Euro From The Top/Down
The Euro really started to crash hard last May. This is something that we all know today, it’s definitely not a secret. But just before the crash, everyone was bullish Euro and history has proven that it was at the exact wrong time. When they’re all leaning towards one side, the ensuing unwind sparks a huge move in the opposite direction. It’s fascinating to watch and we see this all the time across asset classes around the world. The title of of my post in May of 2014 was, “The Euro is About To Get Smoked”. It’s been incredible to witness, but since this March, we’ve started to see the opposite sort of sentiment (see 3/11/15 and 3/12/15). That’s when we want to pay attention.
Price-wise, I want to take a top/down approach with the $EURUSD today and start with a bigger picture weekly timeframe. This is the exact same chart that I posted last May as everyone was getting bulled up right when prices were running into a six year downtrend line. After crashing over the next year, prices have come down to a parallel downtrend line connecting troughs since 2007:
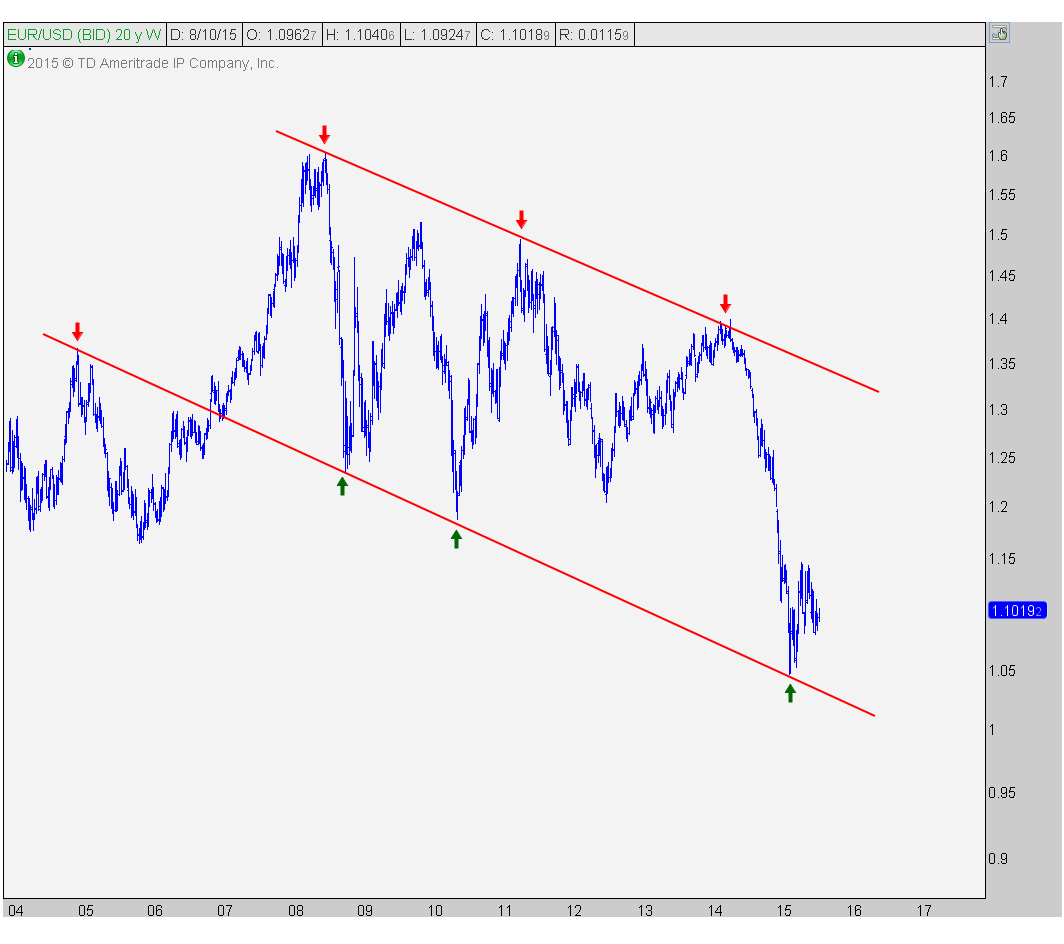
Is this reason alone to bottom fish down here? I personally don’t think so, but according to most recent C.O.T. reports, the commercial hedgers, or “smart money”, are net long with some of the most bullish positions in years. Although they aren’t as long as they were back in March, they definitely still like them and the smart money thinks we’re heading a lot higher.
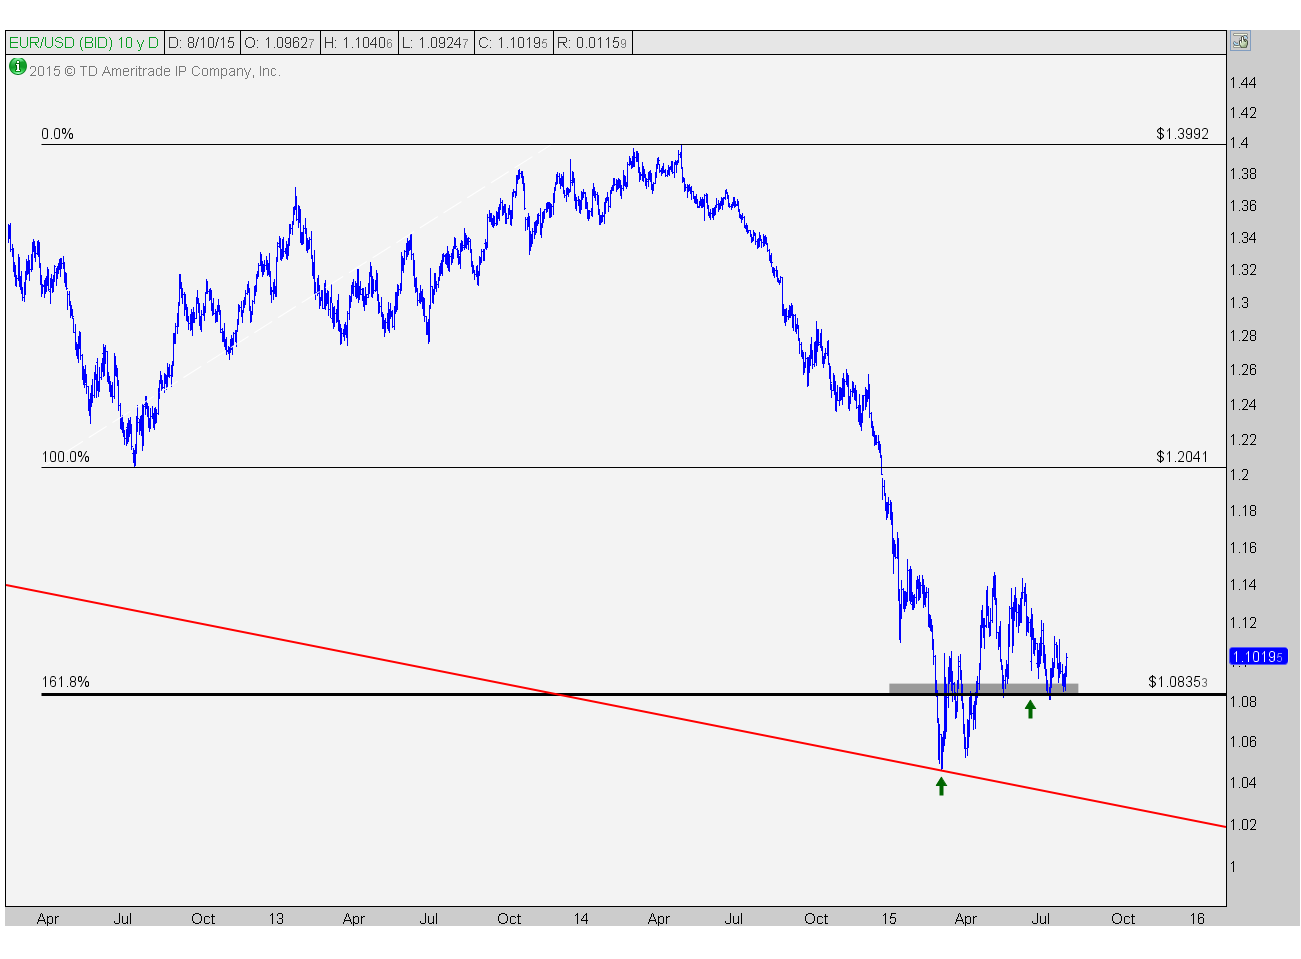
Taking closer look at the first chart, here are the daily bars. We can see prices coming down to that downtrend line connecting the troughs since early 2007. This was down under 1.05 but quickly recovered over the next couple of months. Notice how on the rollover back down, prices have now found support just above 1.08 which represents exactly the 161.8% Fibonacci extension of the most recent rally in $EURUSD that was sparked from extreme bearish sentiment in the Summer of 2012 (see here):
There is a lot of support clustering together down here as sentiment is near extreme bearish levels. Bigger picture, the weight-of-the-evidence is suggesting that shorting Euro down here is probably not the best idea. So we want to turn to the short-term charts for execution purposes. Here is a daily candlestick chart of $EURUSD with a 200 day simple moving average, that we mostly use for trend recognition, as well as a 14-day relative strength index (RSI) that we use for momentum readings:

There is some good news and some bad news. The short-term view reiterates some of the positives mentioned above like prices bouncing off that key downtrend line connecting troughs since 2007 and new support above 1.08 from the key Fibonacci extension from the big rally off 2012 lows. I would also like to add that momentum hitting overbought conditions in early May and staying above oversold conditions during the correction since then is another bullish characteristic.
My biggest problem with this one is that we are still trading in a downtrend in price while below a downward sloping 200 day moving average. The amount of downside pressure in this thing suggests that patience is probably still key here. We want to give this some more time to allow the 200 day to flatten out and continue to put in a bottom. Remember this is a process.
What do we want to see going forward? We want momentum to stay out of oversold conditions. A characteristic of assets that are in bullish trends is when momentum hits overbought readings during rallies and stays above oversold readings during corrections. We have that so far and would like to continue to see this.
Some more sideways grind as we head into the Fall would be another positive. This would allow enough time to get that 200 day moving average to flatten out and let prices start to trend above it. I don’t think this happens tomorrow so we’ll sit tight in the meantime (see: Why Opportunity Cost Can Get Expensive)
If prices start to fall below 1.08 and momentum starts hitting oversold conditions again, I think this could be fatal for $EURUSD. Bulls don’t want to see this. So based on the weight-of-the-evidence, I am cautiously optimistic I like the beginning of this reversal. I don’t want to be short (yet), and would look to be a buyer after further consolidation and time.
***
Click Here to receive weekly updates on these charts as well as multi-timeframe analysis for the rest of the major currencies and 16 commodities futures contracts.

Tags: $EURUSD $FXE $DX_F $UUP $6E_F